The Centers for Medicare and Medicaid Services (CMS) recently released data that highlights the benefit designs of 2023 Medicare Advantage (MA) plans, inclusive of each MA product’s dental offering. To help our clients understand the results, HealthScape Advisors has quickly ingested the data to provide preliminary insights on where the MA dental benefits are headed next year. Newly added this year, is an analysis of annual maximum benefit trends to highlight how this financial control measure has been implemented by a variety of Medicare Advantage Organizations (MAOs).
Dashboard Highlights
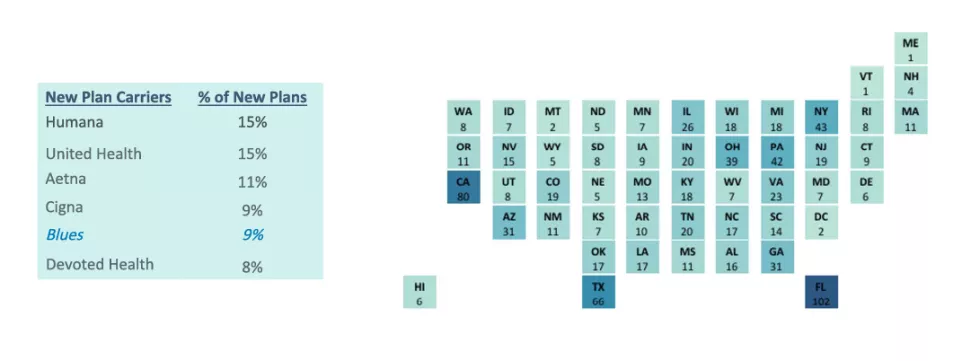
New MA Plan Growth
Highest concentrations of new MA Dental plan growth occurred in FL, CA, TX, NY, and PA; as seen in previous years, growth continues to align with states that are very populous or that skew older in their demographics. While many of the same carriers continue to offer the majority of new plans, Devoted Health’s expansion into eight new states has led the carrier to emerge among the top six carriers for new plan offerings.
All MA Plan Dental Benefit Trends
Fluoride treatment and Diagnostic Services continue to have strong year over year growth, especially when compared to other categorical growth. However, while the growth within other preventive services has seemingly remained stagnant, nearly all comprehensive services saw significant growth from 2022 to 2023.

Geographic Advances in Dental Benefits
Similar to trends seen in new plans for 2023, renewed plans are also increasingly expanding benefit coverage across several geographies.

New MA Dental Plan Benefits
Nearly all new 2023 plans offer some form of preventive and comprehensive benefits, demonstrating the continual growth in benefit coverage and that both types of coverage are now “table stakes” for MA plans.

Existing MA Plan Geographic Shifts in Dental Mandatory Benefits
Several states such as Montana, Indiana, and North Carolina have seen an expansion of mandatory benefits in their renewed plans – many increasing in larger magnitudes than the top increases seen last year. Whereas last year several states saw a decrease in average mandatory benefits within renewed plans, all states in 2023 saw either no change or an increase for renewed plans in 2023.

MA Dental Average Associated Mandatory Benefits
Following trends seen in previous years, carriers continue to expand the breadth of MA Dental coverage across the 11 measured mandatory plan benefits. From 2022 to 2023, the national average of total mandatory benefits grew approximately 10%.

Benefit Coverage in Plans with $0 Premiums
While the availability and popularity of plans with $0 premiums continues to steadily grow, so too does the prevalence of dental benefits. While preventive benefit coverage has slightly decreased after many years of consistent growth, comprehensive benefit coverage continues to expand.

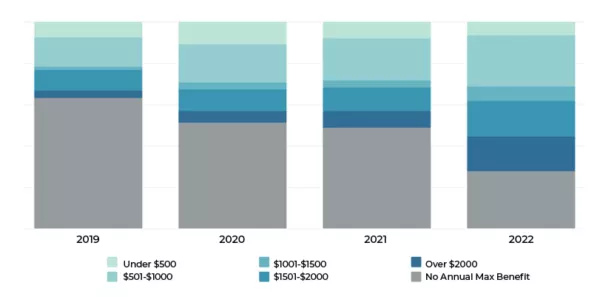
Annual Max Benefit Enrollment by Cohort
In recent years, the use of annual maximums as a financial control measure has become increasingly popular. In 2019, ~60% of MA members were enrolled in plans with no annual maximums, compared to ~30% in 2022 – a trend that is expected to continue given 25% of 2023 plans have no annual maximums.
Closing Thoughts
As indicated by the above trends, dental benefits continue to expand and be made increasingly available to the MA population. Customers now expect dental coverage to be a table stakes benefit and the MAOs that continue to invest in dental as a key component of their supplemental benefits portfolio will be best positioned to attract and retain members in the coming years.
HealthScape Can Help
HealthScape brings a “think national, analyze local” approach to dental benefit assessment. We pair our expertise in evaluating and synthesizing macro market forces with local market considerations to enable plans to expand and optimize their geographic footprint and dental benefit design.
Check out our MA Dental Benefit Compare demo here.
Additional contributors include: Rachel Ferko