This brief details HealthScape Advisors’ first look at Medicare Advantage (MA) 2022 Annual Enrollment Period (AEP) results. As additional enrollment data becomes available from the Centers for Medicare and Medicaid Services (CMS), we will update this brief with any significant findings or changes to this analysis.
Key Highlights Of This Brief:
-
The past repeats itself as roughly three-in-four of the nearly 940K net new enrollees selected a National health plan. UnitedHealthcare captured 40% of net new enrollees.
-
Individual Blue plans, Provider-Sponsored plans, and Start-Ups had variable membership growth.
-
Across all health plans, nearly two individuals selected a PPO plan for every one individual that chose an HMO plan.
-
While attracting new members is important, retaining and meeting the expectations of existing membership is just as critical to long-term success in MA.
-
A clear strategy and unwavering focus are critical to succeed in this highly competitive market.
The Big Keep Getting Bigger, But Market Competition Is Heating Up
The MA market grew 3.4% from 27.7M enrollees in December 2021 to 28.6M enrollees in January 2022. Continuing previous AEP trends, of the nearly 940K in net new enrollees in January 2022, roughly three-in-four enrollees selected a National health plan (“Nationals”)1, helping them retain their dominant market share position. Blue Cross Blue Shield plans (“Blues”) and Provider-Sponsored health plans (“PSPs”) lost minimal market share position (less than 0.5% each), ending at ~17% and ~8% of the market, respectively. Though comprising less than 2% of the overall market, newer entrants to the MA market (“Start-Ups”) captured modest market share (less than 0.5%). We will discuss the differences in performance by each of these plan types in greater detail in subsequent sections.
Figure 1: Change in Medicare Advantage Enrollment December 2021 to January 2022 by Organization Type

Figure 2: Top 10 Health Plans by Medicare Advantage Enrollment Growth between December 2021 and January 20222
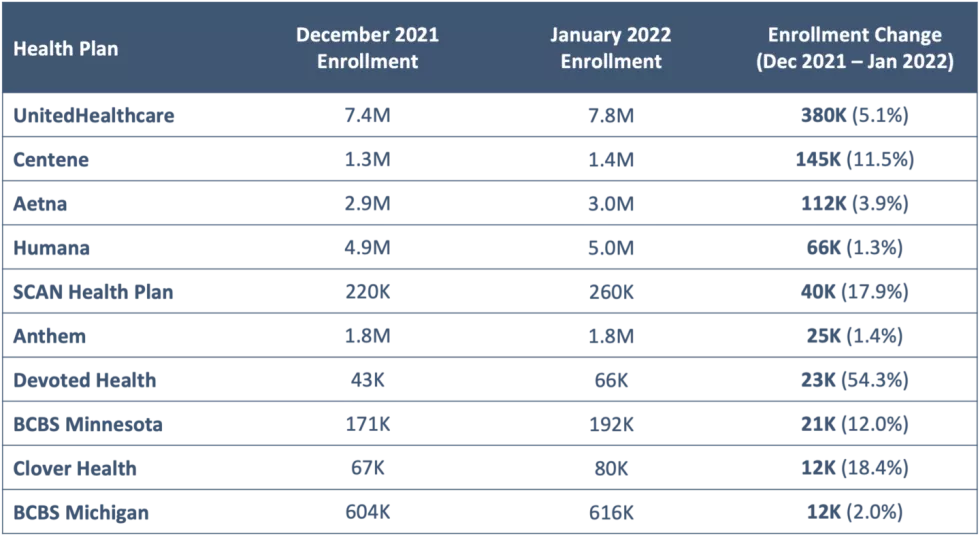
Nationals Continue To Dominate
Nationals have dominated the MA market in recent years, due in large part to the scale of these organizations, which has enabled them to make the investments (e.g., geographic expansion, benefit enhancement, marketing) that have translated to enrollment and market share growth. For example, UnitedHealthcare offers MA plans in 74% of all counties nationwide, with 90% of Medicare beneficiaries having access to at least one UnitedHealthcare MA plan as of the writing of this brief.
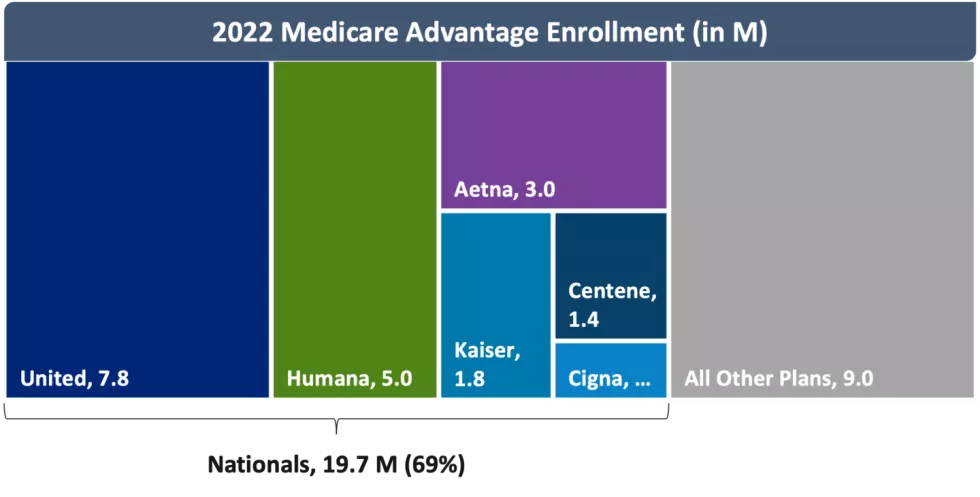
As of January 2022, Nationals collectively accounted for 69% of the MA market. While Nationals added ~690K members from December 2021 to January 2022, the growth was largely led by UnitedHealthcare which accounted for 40% of overall MA market growth with close to 380K new members. CVS Health (Aetna) and Centene both added more than 100K members at the turn of the new year.
Not all Nationals fared as well. Kaiser and Cigna both experienced less than 1% enrollment growth. Humana made headlines at the beginning of the year after flattening its MA growth projections, followed by an announcement that it would reinvest $1B in its MA business. Despite missing growth expectations, Humana still added the fourth most members among all MA plans and is second in overall MA market share.
Figure 3: 2022 Medicare Advantage Enrollment (in M)
Blues Have Mixed Results
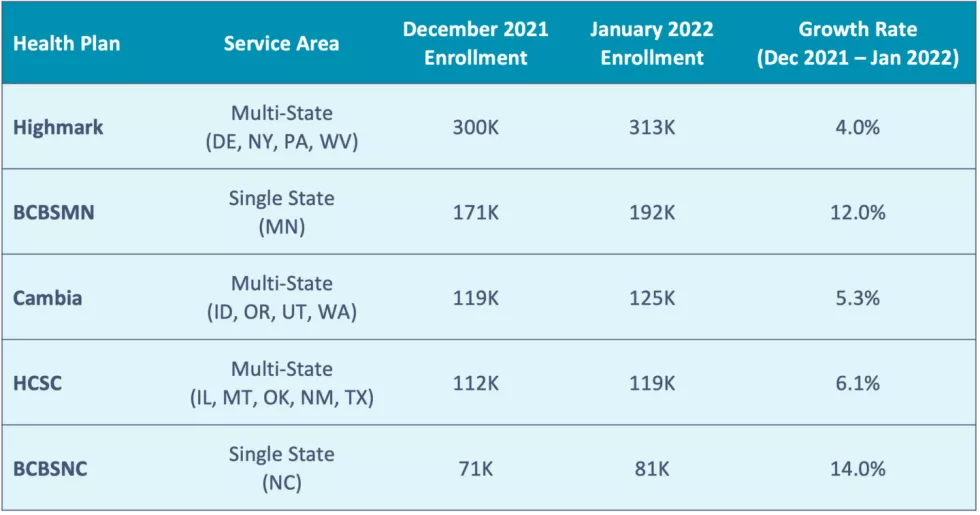
Enrollment in Blues grew by ~110K members during AEP, but this growth rate was not enough to increase the Blues’ overall MA market share, which remains just under 17%. These numbers hide the diversity of individual Blue plan results, given the range of size (from Blues in the Great Plains with a few thousand members to Anthem’s 1.8M members) and geographic span (over 31 plans covering all 50 states plus D.C. and Puerto Rico) of these plans.
The two Blue plans (with over 75K members) that experienced the most membership growth during AEP – Blue Cross and Blue Shield of North Carolina (BCBSNC) and Blue Cross and Blue Shield of Minnesota (BCBSMN) – are single-state service area plans. The other Blues with the most enrollment growth – Health Care Service Corporation (HCSC), Cambia Health Solutions (Cambia), and Highmark Inc. (Highmark) – span multiple states. Other Blues have had success with partnership strategies; for example, Braven Health, which is a partnership between Horizon Blue Cross Blue Shield, Hackensack Meridian Health and RWJ Barnabas Health grew nearly 6K members from December 2021 to January 2022. Overall, most Blues showed modest growth but not at the same magnitude as the larger Nationals.
Figure 4: Blue Plans with the Most Enrollment Growth3(>75K Members)
Few Provider-Sponsored Plans Experience Significant Growth
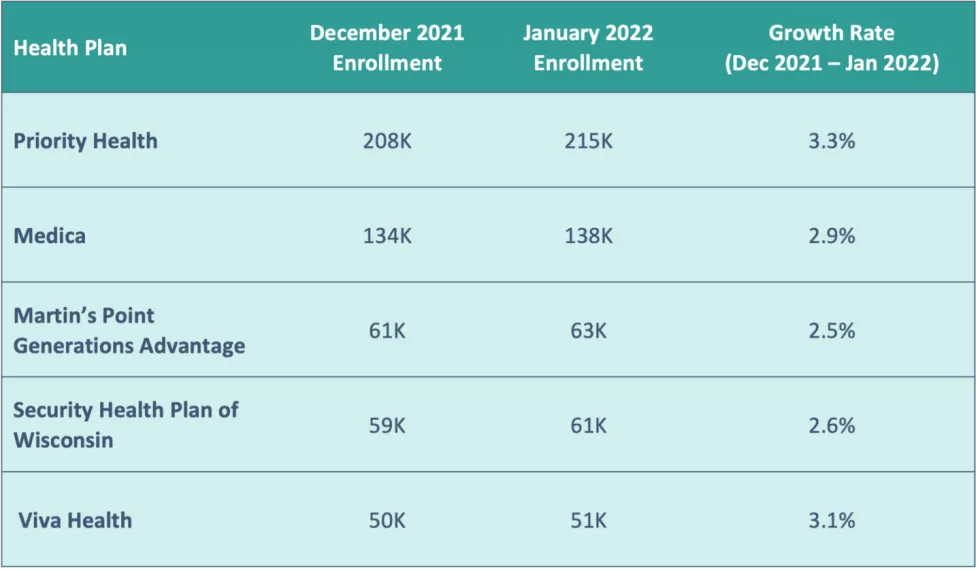
Results for PSPs mirror those of the Blues. Only two PSPs — Priority Health and Kaiser (which is classified as a National for purposes of this analysis) — ranked in the top 20 plans for enrollment growth. Generally, PSPs experienced modest growth, but saw their overall share of the MA market decline at the expense of Nationals and Start-Ups. However, many PSPs experience steady growth outside of AEP given the nature of their health system relationship and opportunity to capture age-in growth.
Figure 5: PSPs with the Most Enrollment Growth3 (>50K Members)
Start-Ups See Limited But Small-Scale Success
Start-Ups made front-page news in 2021, as the digital health boom led health plans such as Oscar Health, Inc. (Oscar), Bright HealthCare (Bright), Alignment Healthcare (Alignment), and Clover Health (Clover) to go public. However, a small portion of seniors – less than 2% – receive their MA coverage through a Start-Up.
Figure 6: UnitedHealthcare’s Enrollment Gains Eclipse Start-Ups’ Performance
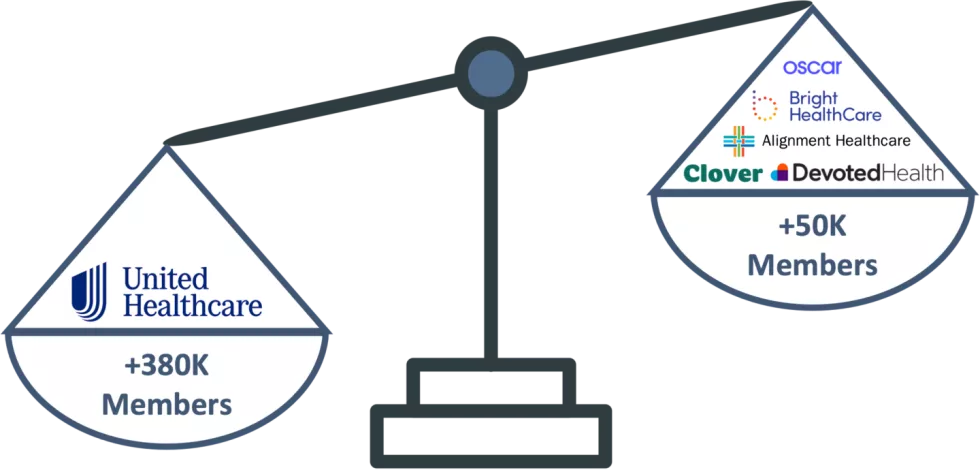
Devoted Health and Clover saw the greatest enrollment gains with 54% and 19% growth between December 2021 and January 2022, respectively. These two together enrolled ~36K members whereas other Start-Ups such as Oscar, Bright and Alignment cumulatively grew their enrollment by less than 5.5K members.
Other Market Trends
Outside of the analyses by plan type above, we have noted a few additional AEP data trends:
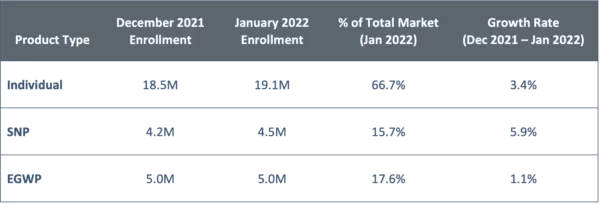
SNP Market Enrollment Outpaces Individual Market Enrollment
The individual MA market, which represents nearly 67% of the overall MA market, grew at a rate of 3.4%.
Enrollment in Special Needs Programs (SNPs) increased by ~250K enrollees, meaning nearly one-in-four MA enrollees enrolled into a SNP. Continuing the trend seen in recent years of health plans and other entities attempting to effectively manage these higher need MA members, the SNP market grew 1.7 times faster than the individual market, at a rate of 5.9%. Within SNPs, virtually all enrollees selected a Special Needs Plan for individuals dually eligible for Medicare and Medicaid (D-SNP). Enrollment growth in other SNP types (e.g., chronic condition special needs plans [C-SNP] and institutional special needs plans [I-SNP]) remained flat.
The modest change in Employer Group Waiver Plan (EGWP) enrollment between December 2021 and January 2022 is not surprising, given the increased flexibility in enrollment time periods in the group MA market.
Figure 7: Enrollment by Product Type
PPO Plans Capture More Enrollment
While more than half of MA enrollees – 58% – are in HMO plans, PPO plans are increasingly attractive with nearly two individuals selecting a PPO plan for every one individual choosing an HMO plan. About 2% of the market remains enrolled in other plan types, such as Private Fee-For-Service (PFFS) plans, Medicare Cost plans, Program of All-Inclusive Care for the Elderly (PACE) plans and Medicare Medical Savings Accounts (MSAs).
Figure 8: Enrollment by Plan Type

Implications For Medicare Advantage Organizations
These results highlight several strategic and operational implications for health plans that should guide their priorities and areas of focus as plans continue into CY2022 and begin planning for CY2023:
You Can’t Fill A Bucket With A Hole
While the focus of AEP is on sales and marketing, health plans are increasingly shifting their focus to retention efforts in order to ensure that they retain their existing members during this highly competitive period. Retention is critical to ensure return on investments for plan efforts in quality, medical cost management and risk score capture. These retention efforts must be customized to unique attributes of membership, including how they purchased their health plan (leading to our next point).
Channel Mix Matters
Health plans are using an increasing number of distribution channels to remain competitive, meet consumers’ preferences towards digital, and respond to the COVID-19 crisis. It is critical to understand the implications of each channel not only on sales production but also on downstream impacts such as member satisfaction, medical cost and member engagement. Health plans should conduct a critical analysis of these channels and scenario plan to develop specific strategies to improve channel performance and retention.
Weakness In The Perimeter
While the Nationals continue to hold the majority of the market, this analysis shows that success against these plans is possible with focus and investment. For example, SCAN Health Plan experienced one of the largest membership gains during AEP through its expansion into new geographies and attracted membership through its competitive benefit design, provider relationships to fuel and fund growth, and targeted outreach efforts to specific demographic cohorts. Devoted Health also experienced significant growth attributed to its relationship with senior-focused provider partners.
Grow Your Own Way
While AEP will always be an important growth period, given the heightened competitiveness across a growing field of well-funded organizations, many plans are looking for “flanking” strategies and opportunities to grow throughout the year. This approach is especially important for plans such as Blues and PSPs that have large commercial populations or affiliated provider patient panels that are aging into Medicare. It is particularly important for plans that have this age-in funnel to develop targeted marketing and member experience strategies to capture this membership base.
Go For Niche
Given that the individual MA-PD market is expected to remain crowded and competitive, it is worth exploring growth opportunities outside of the individual market. As noted in our analysis, the D-SNP market experienced the fastest rate of growth. D-SNP will likely remain a growth opportunity and MA plans can explore other alternatives to the individual market, including group (EGWP) and other SNP types (C-SNP, I-SNP). Before pursuing these growing paths, it will be important for plans to determine whether they have the capabilities and operating model to serve these unique populations.
HEALTHSCAPE CAN HELP.
Serving the senior population is a strategic imperative for healthcare organizations, notably MAOs. Every year, AEP provides a glimpse into the effectiveness of MAO strategies. Our team partners with plans to design, launch and execute on competitive strategies for MA plans to succeed in this market. Contact Alexis Levy for more information.
Notes: 1Nationals include all non-Blue affiliated plans with >500K membership across a multi-state service area (UnitedHealthcare, Humana, CVS Health [Aetna], Kaiser, Centene, and Cigna). 2Excludes enrollment growth due to acquisition (e.g., MHH Healthcare acquired Medical Card System, a Puerto Rico-based healthcare services organization). 3“Most Enrollment Growth” defined as those health plans with the largest growth rate from December 2021 and January 2022 CMS enrollment files.
Note on Data Used: HealthScape Advisors analyzed Center for Medicare & Medicaid Services (CMS) Monthly Enrollment by Contract/Plan/State/County (CPSC) files from Report Periods 2021-12 and 2022-01 for this perspective (available here). The report provides monthly enrollment at the contract, plan, state, county level for all organization types. Please note CMS suppresses enrollment figures in counties where the enrollment for a specific Contract-Plan ID in a particular county is less than 10. Our analysis excludes Medicare Advantage Prescription Drug Plan Enrollment.